Artprice applies financial analysis technique to art market
Following the launch of its new art market indices, Artprice, a leading provider of art market information, has begun modelling and representing the art market via a technique commonly used on financial markets: Japanese candlestick charts.
Japanese candlestick charts take their name from a system whose origin dates back to the 17th century. Traditionally used to represent changes in rice prices, it is the oldest known form of graphical analysis allowing a simple and intuitive representation of price variations.
Not only do the method’s graphics provide an easy visualization of market trends (growth, stability, trend reversals, etc.) they also, most importantly, indicate or suggest the direction of future movements.
“This project would not have been possible without Artprice’s databases containing highly exhaustive information on international auction results over more than 15 years,” said Artprice CEO Thierry Ehrmann.
“The candlesticks technique of stock market analysis could not be applied to the art market without this wealth of accumulated data.”
He said that Artprice has conducted painstaking research to validate this highly original concept.
“A candlestick representation of the evolution of the art market does indeed point to a number of changes that are perfectly consistent with major events (both exogenous and endogenous to the art market).”
He added that Artprice also found a surprising level of correspondence between the graphics and subsequent reality when studying specific periods or when using the technique for specific artistic mediums, and even for the price evolutions of individual artists in recent years.
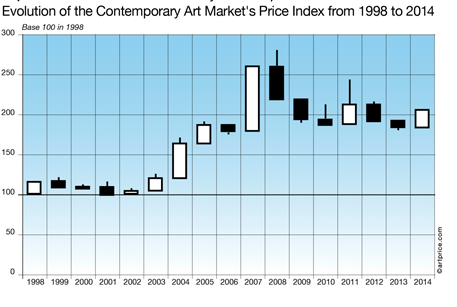
Artprice’s exclusive illustration of the evolution of the Contemporary art market in Japanese candlestick format shows that after 5 years of evolution in a relatively stable range with little sensitivity to stock market trends, the Contemporary art market took off during 2003, breaking a resistance at 120 points in place since 1999.
That growth was confirmed in 2004 with the emergence of a strong bullish trend that, after a little hesitation in 2006, turned into a white Marubozu in 2007, i.e. a continuous rise in the price index over the entire year. At the summit of a trend, this candle represents a final blow-up.
In 2008 a reversal was indeed confirmed with a strong contraction of the Contemporary art market. The market’s index closed the year below the 2007 closing level, illustrated by a black candle that clearly portrays a trend reversal.
Since then, the Contemporary Art Market has been trying to find a stable base. Having shown renewed signs of bullishness in 2011, it seems to be settling down at around 190 points.
“In conclusion, the Contemporary Art Market is now evolving within a consolidation wedge, and its exit angle from this configuration should determine the direction and magnitude of the next movement,” said Ehrmann.
“The outlook for this innovation is remarkably promising. In the near future, Artprice will use technical analysis methods to explain past trends. It will also try, in the framework of hypothetical forecasts, to predict future movements of the art market as a whole, but also of its different segments, different geographical zones, different mediums and individual artists. All of these predictions should contribute to a better understanding of the market’s specificities.”
The paid-for data will be available through Artprice Terminal and Artprice Screen.
Detailed results of these technical analyses will be published when available on the twitter accounts @artpricedotcom and @artmarketdotcom.